Sales Productivity
Sales Productivity and GridBuddy: Transpose and Edit your Salesforce Data to Get the Answers You Need
minute read

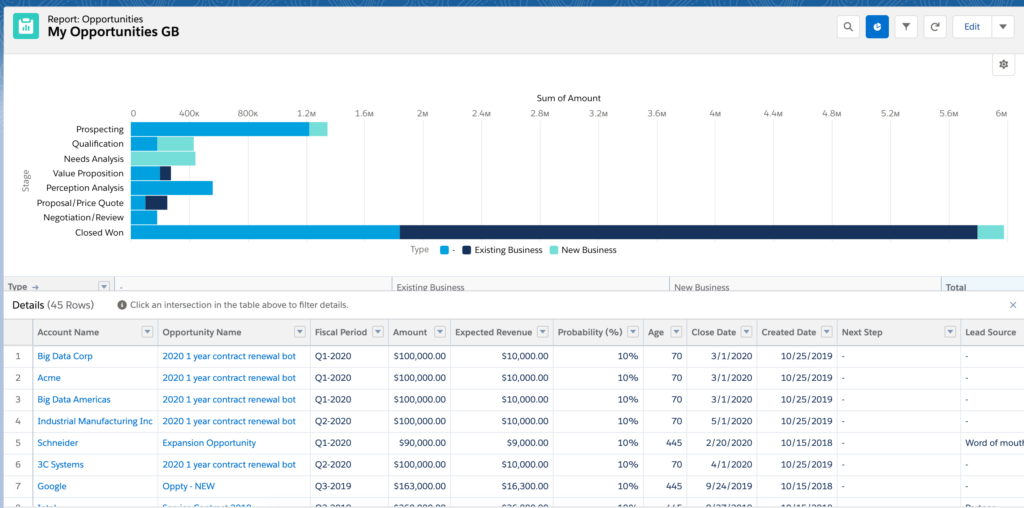
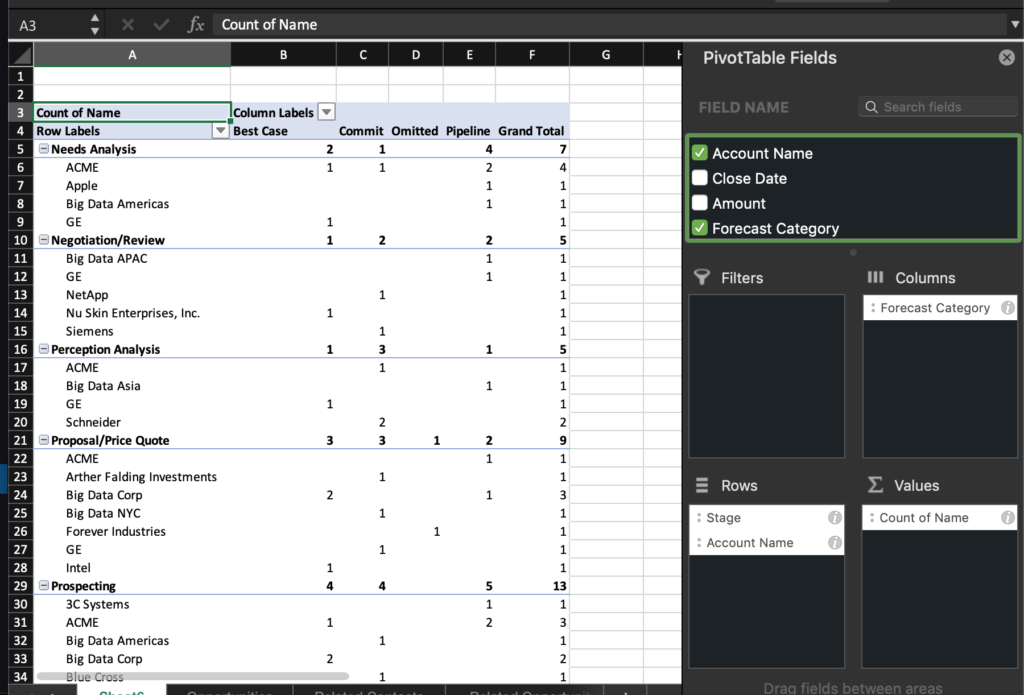
We’ve all used Salesforce reports to answer questions about our data. Sometimes I can get answers without too much work, but more often than not, I have to create multiple complex reports and I’m still left with unanswered questions. An alternative would be to open everything in Excel and use a pivot table, but now my data is outside of Salesforce.
Once I have answered my questions via a Salesforce report or an Excel pivot table, I must go back to the source data to make changes to each record: Neither reports nor pivot tables allow direct edits. In Salesforce reports, I have to drill into each record, one by one, to make any changes:
In Excel pivot tables, I have to open and edit the source sheet. I can’t edit anything in the pivot table itself. Plus, there is the added inconvenience and risk of working outside of Salesforce.
Wouldn’t it be nice if I could answer all my questions and edit my data in one place, within Salesforce? Good news: GridBuddy’s Editable Forecast View (EFV) can do this!
Forecast Your Data While Keeping It Fully Editable
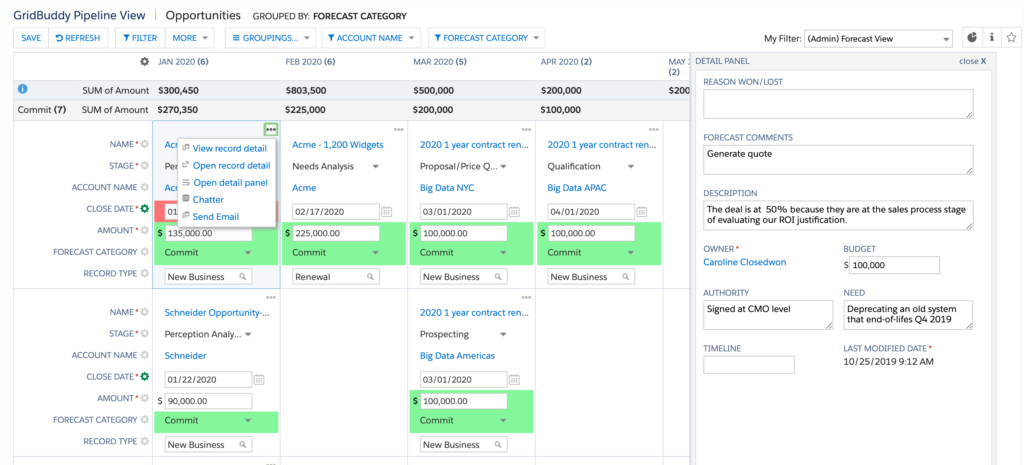
Within step three of the Grid Wizard is a filter called the Editable Forecast View. EFV allows you to transpose your data just the way you do in a pivot table. Using up to three row groupings, you get a birds-eye view of your data for at-a-glance answers. Better yet, you can edit all your records inline and save once at the end, all without leaving Salesforce.
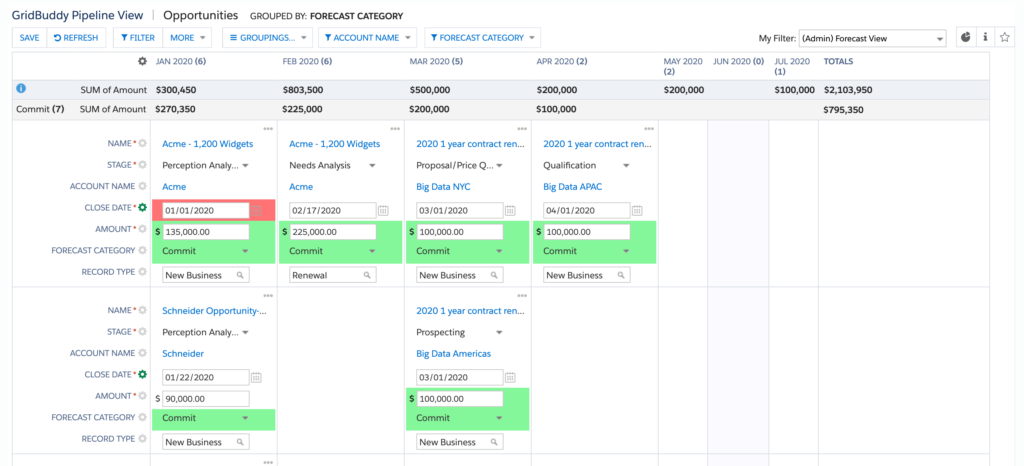
EFV is pretty straightforward: First, create the filter just as you would any other admin or user-defined filter (step 3 of the Grid Wizard, or just click the “filter” button). Save it, then select it from the filter dropdown menu at the top right of your grid. As soon as the filter is selected, your grid records will appear stacked vertically in a Kanban–style, editable interface. (See why the AppAssessor said, “When I found the Kanban view, GridBuddy became the grid that keeps on giving!”)
The above screenshot shows an Opportunity grid with an EFV filter applied. Rows are grouped by Stage and columns are grouped by Close Date, which gives you a clear view of the upcoming pipeline. Each “box” is a record, and the fields are editable based on your permissions. (Learn more about GridBuddy EFV here.)
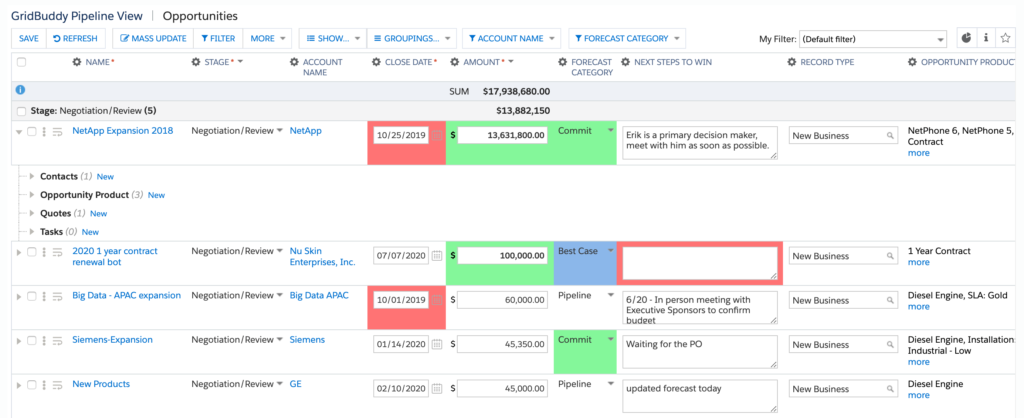
Below is a screenshot of the same Opportunity grid but without the EFV filter applied. This is the hierarchical view, available alongside the forecast view filter. You can click between these two views using the filter dropdown menu at the top-right of your grid. Easy!
Don’t worry: Data cards are still available in the forecast view, but they’re called the “detail panel” here. Instead of expanding below each record, they expand to the right of the grid. All the fields you configured in the data card will be available and editable here.
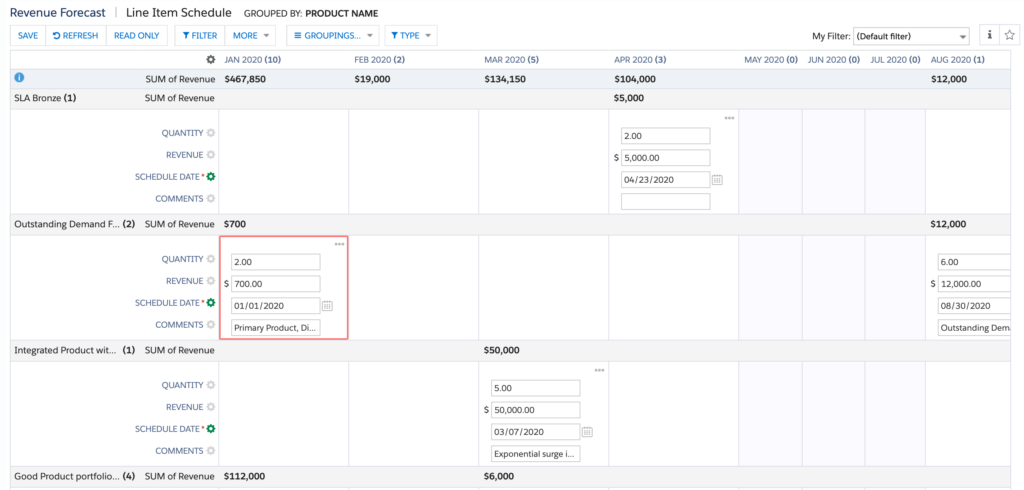
In the screenshot below is a Line Item Schedules grid with a forecast view filter applied. The columns are grouped by Schedule Date and rows by Line Item Description. Notice how the white space really stands out? No chance your end-users will miss those empty spaces. Other records are wrapped in a red box to show that the record is past-due (via conditional formatting).
Choose GridBuddy to Boost Sales Productivity
Learn more about GridBuddy here, read a review from the AppAssessor on SalesforceBen.com, or contact us for a custom demo. We’d love to hear from you.
